Bivariate choropleth study, poverty and inequality in Maryland
A study of using color to encode two variables at once, on a bivariate choropleth map. (Bivarite: two variables. Choropleth: a map where the color of areas represents information about those areas.)
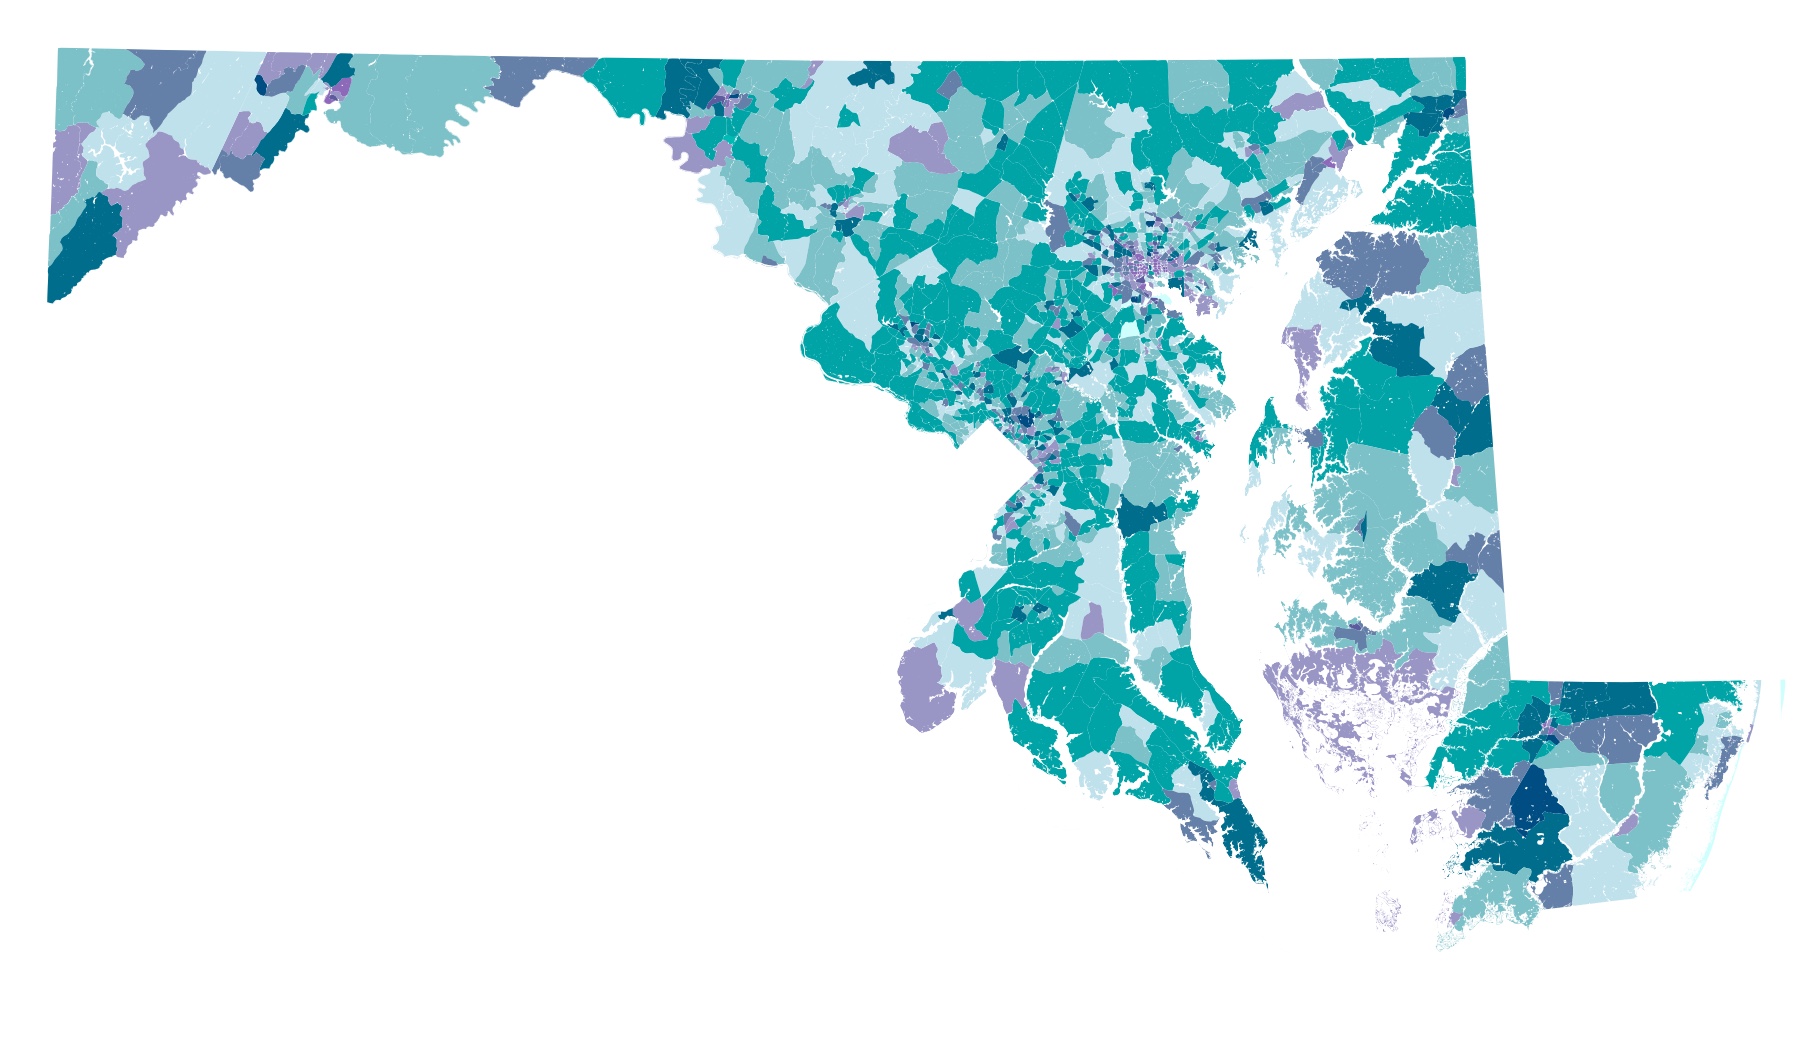
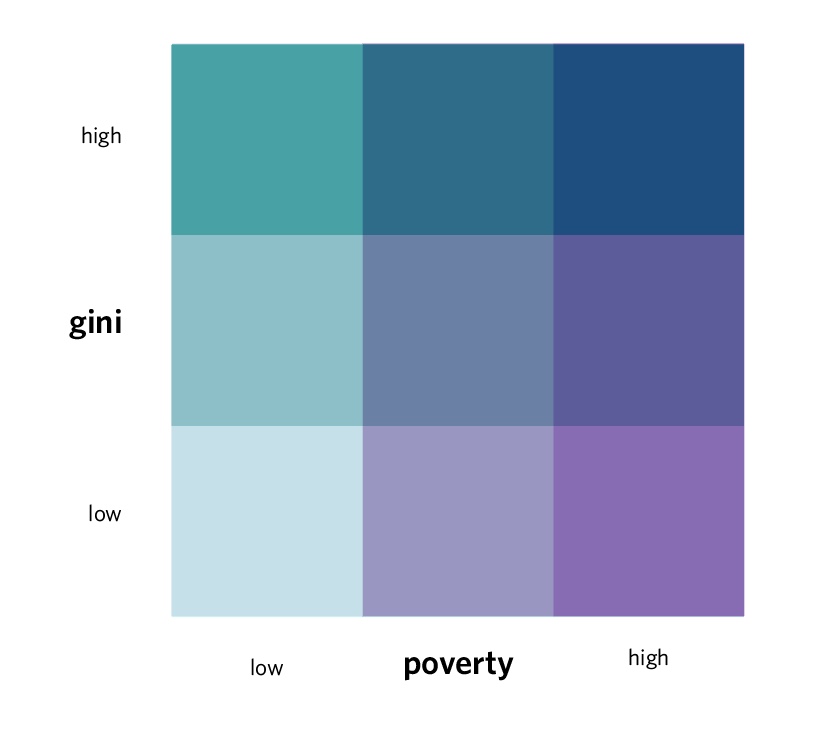
This map shows the poverty rate and Gini index for census tracts in Maryland. The Gini index is a measure of inequality. A low Gini index indicates relative equality, while a high Gini index marks relative inequality.
Data come from the American Community Survey 5-Year Estimates (2016–2020).
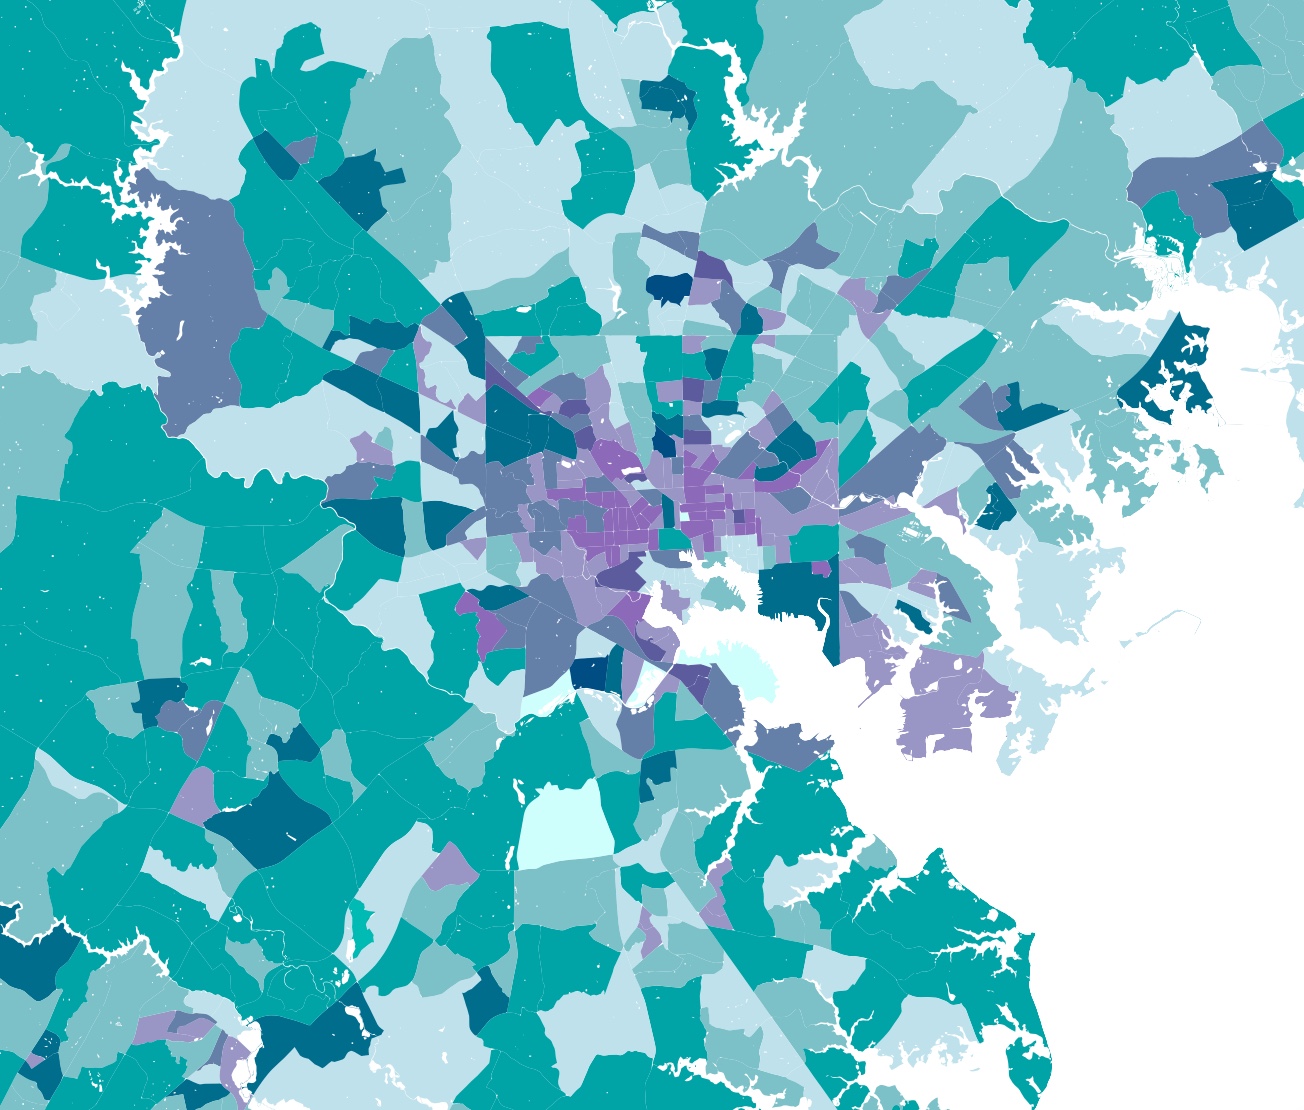
Baltimore City and surrounding areas of Baltimore and Anne Arundel counties.
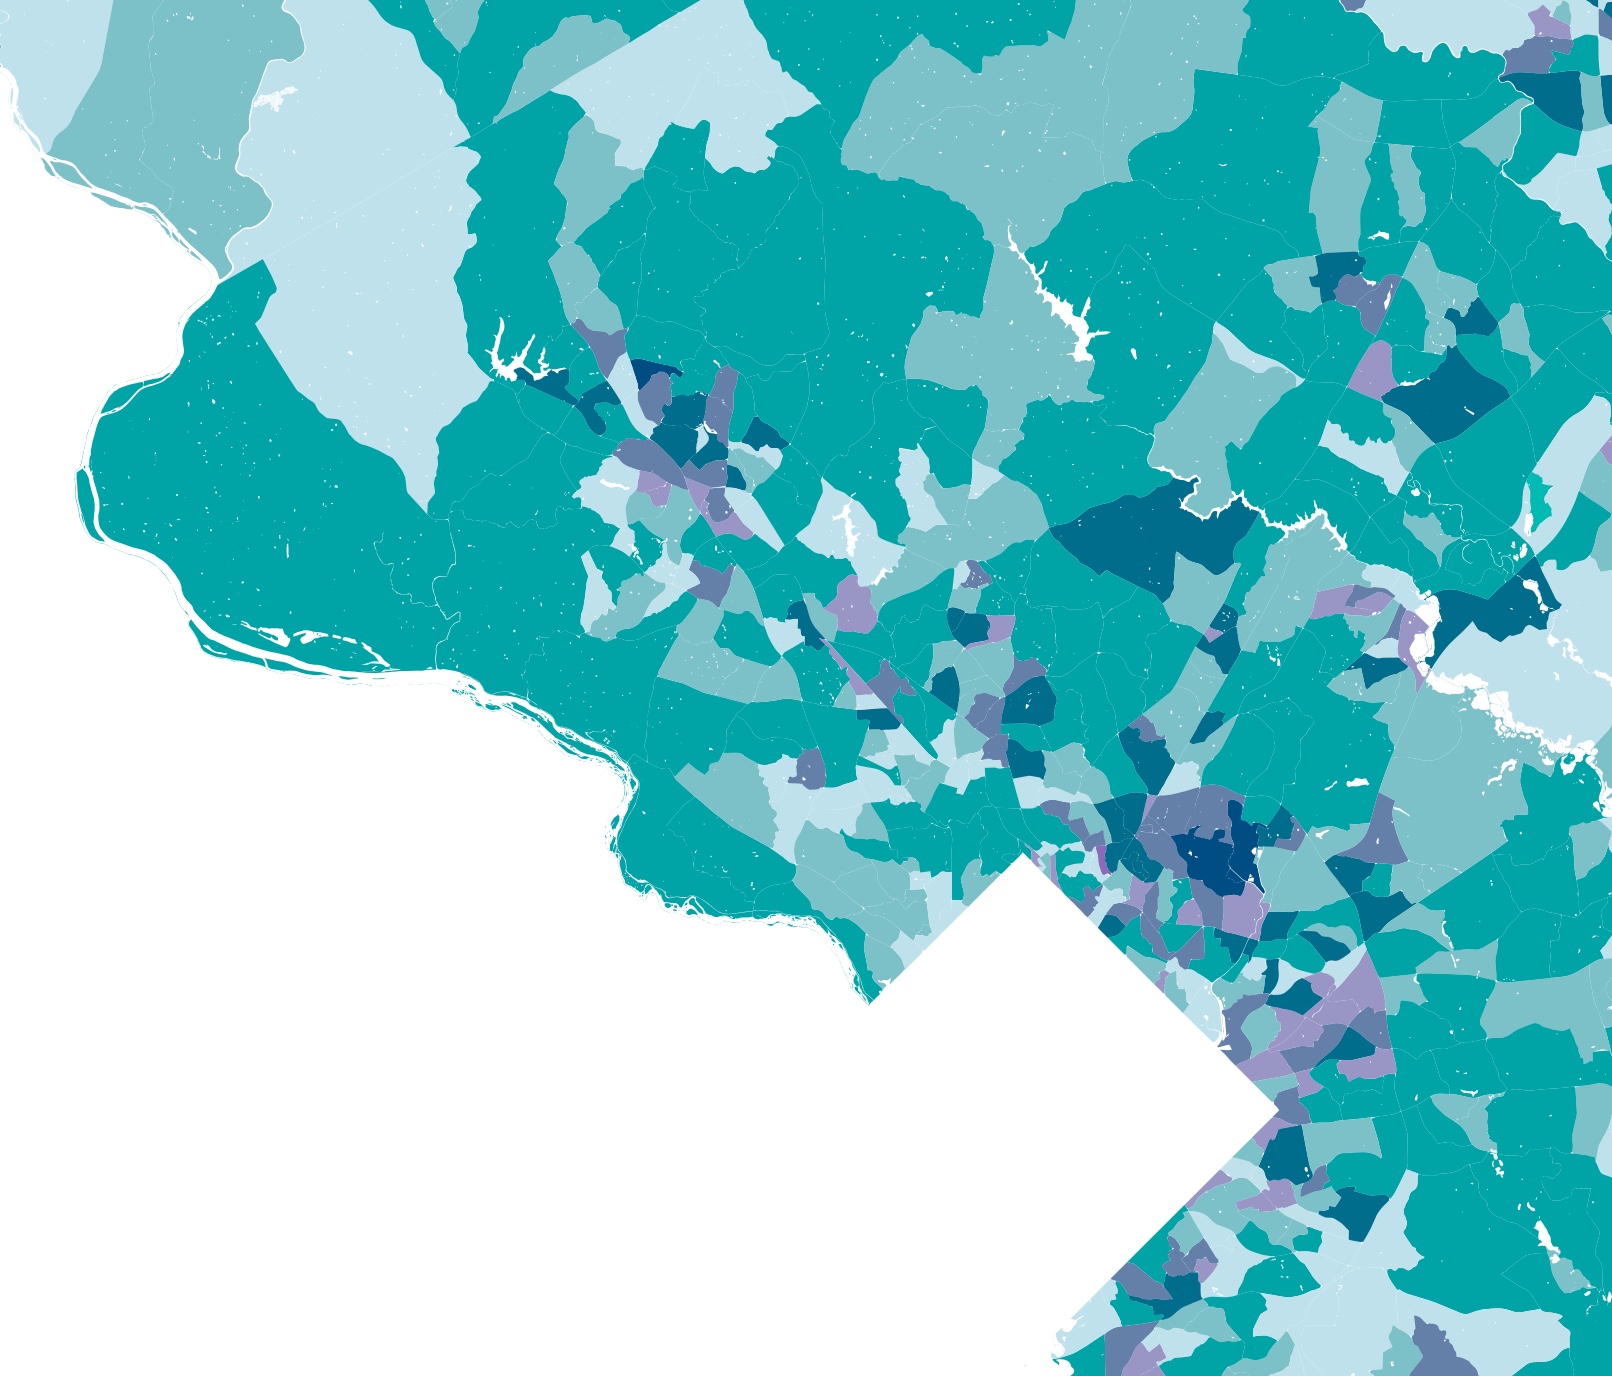
Suburbs north of D.C., Montgomery County and parts of Howard and Prince George's.