A LIDAR-based shaded relief map of D.C.
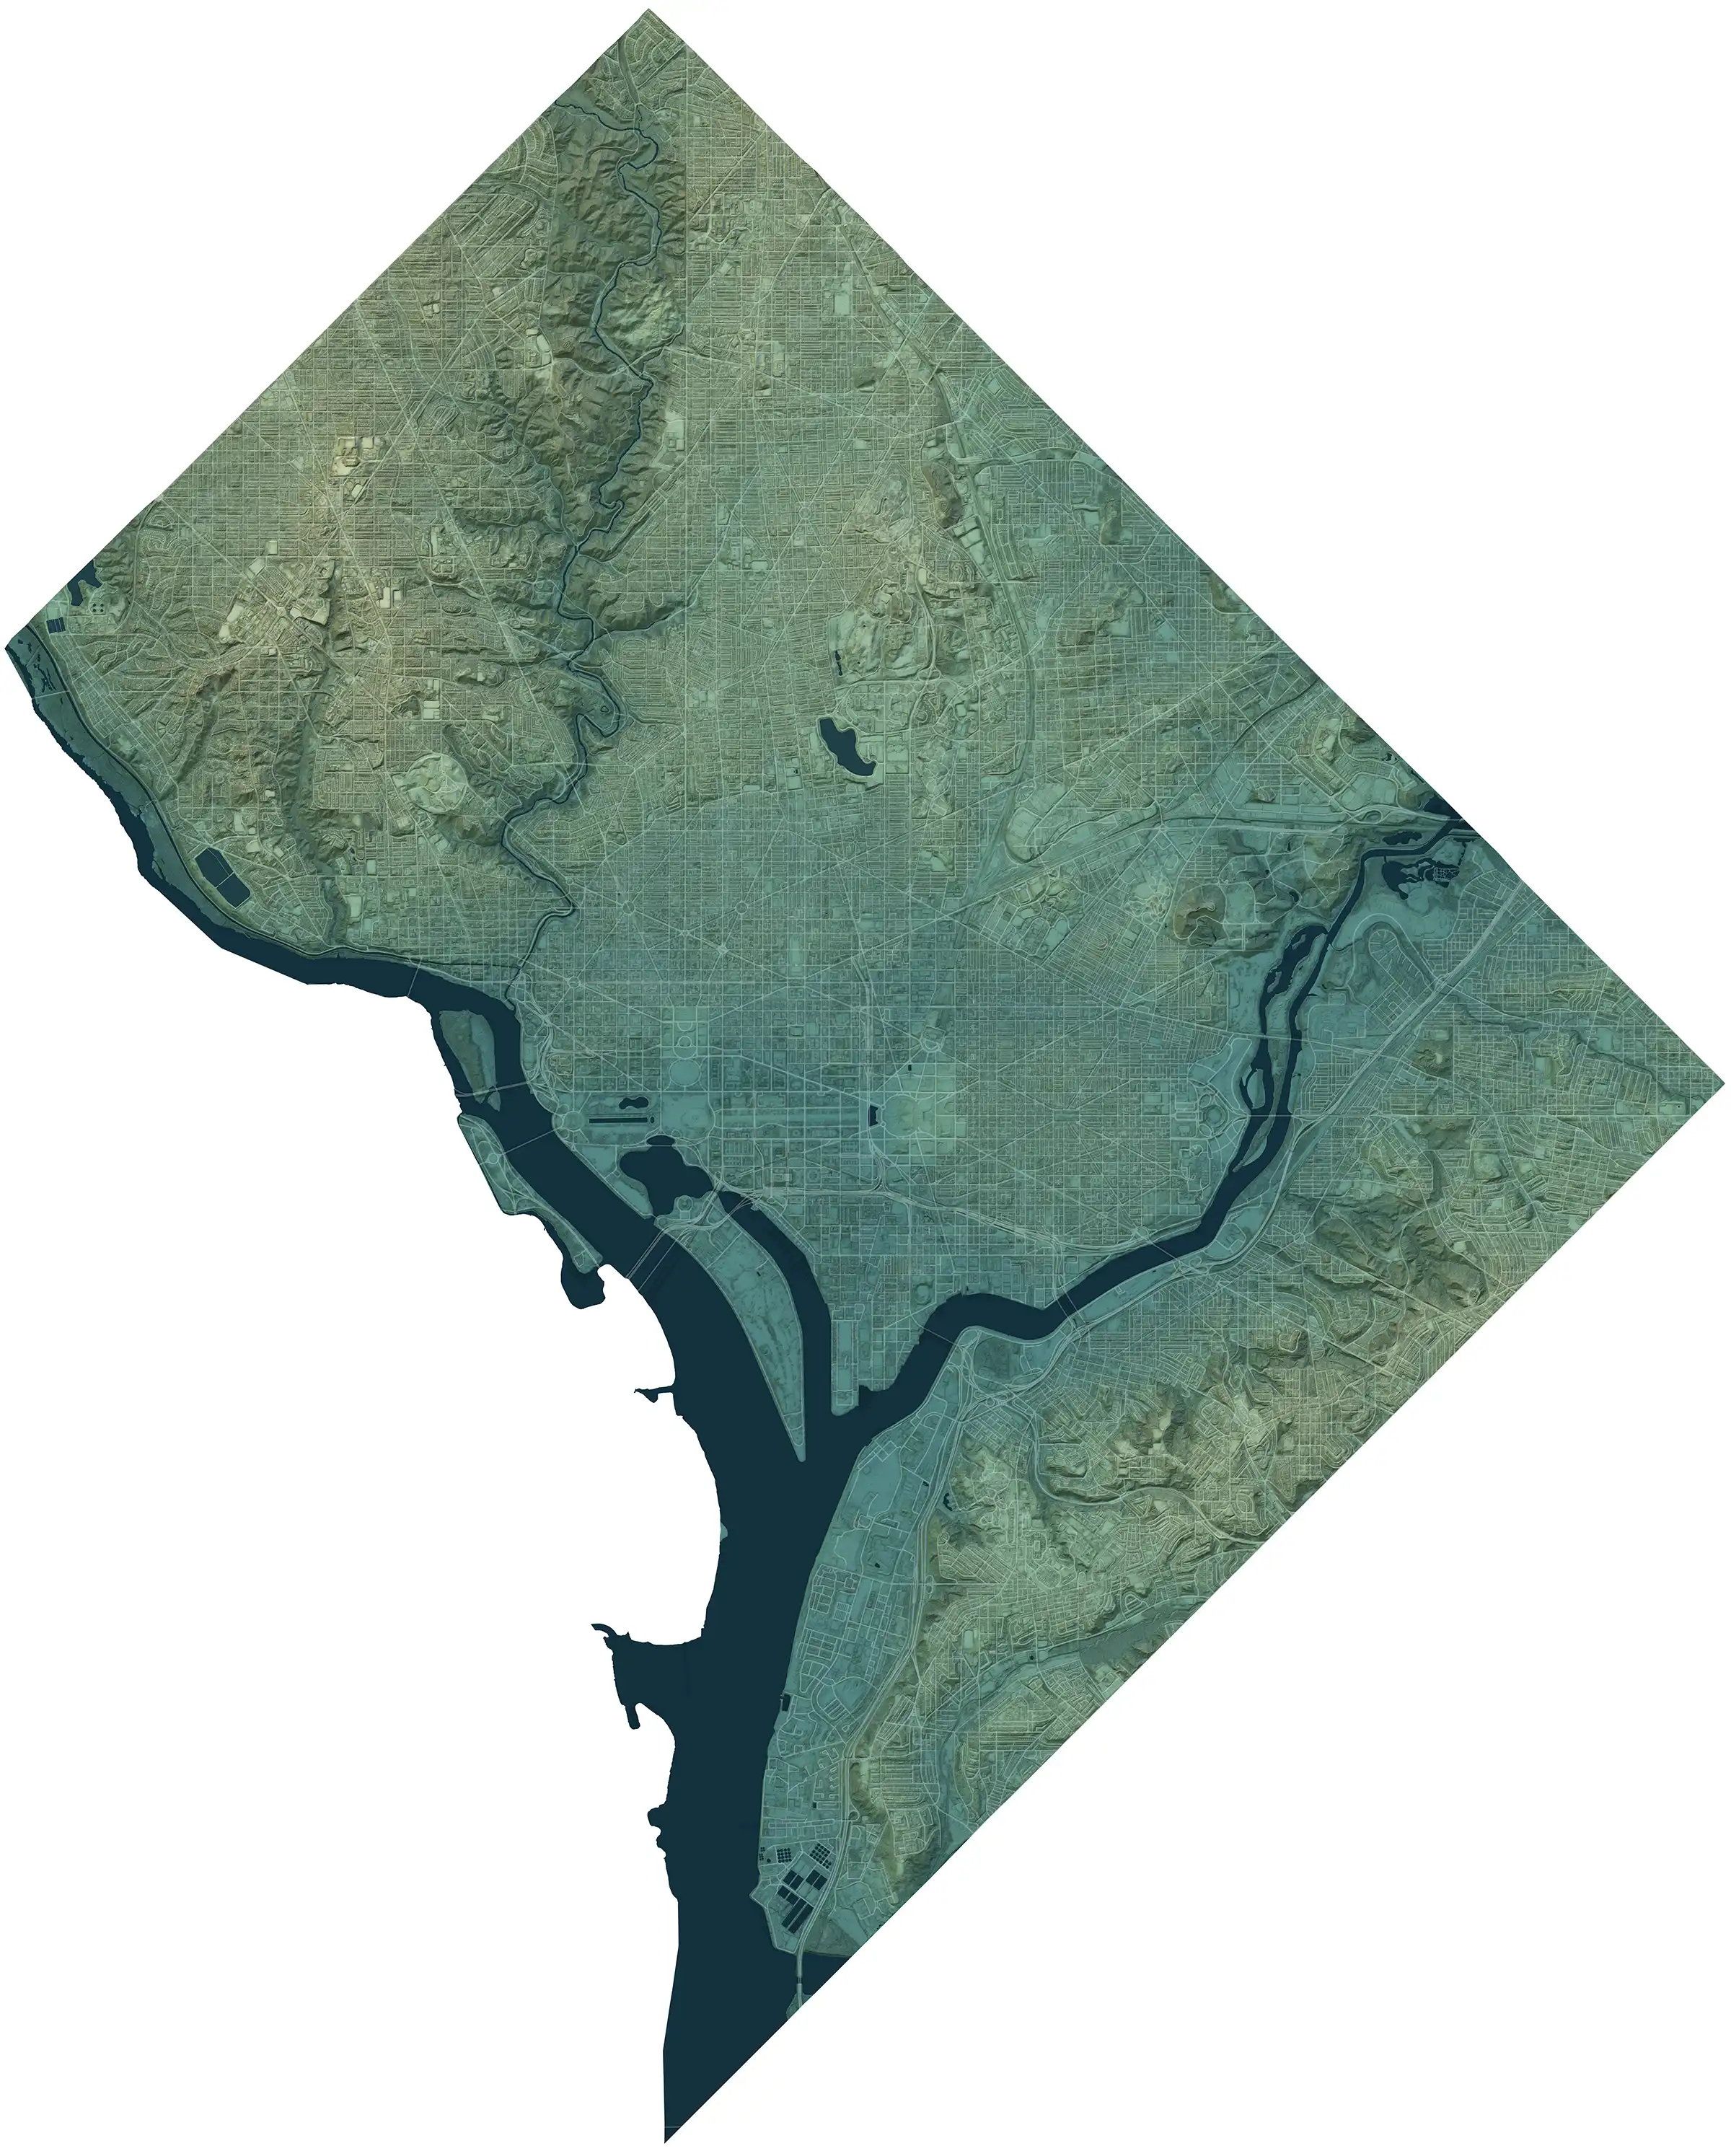
A study of color, LIDAR data, and shaded relief, showing terrain, structures, and tree cover in Washington, D.C. I’m interested in this combination of data sources and techniques because the resulting map resembles the real world, but is still more abstract and controlled than an aerial photo or even a 3D rendering of the same data.
Hillshading via Eduard, which produces fantastic results — main illumination from the northwest, secondary light from the northeast, and a faint ambient occlusion layer for details and hypsometric tinting to help resolve elevations. There is a faint overlay of buildings and trees from the LIDAR-derived nDSM.
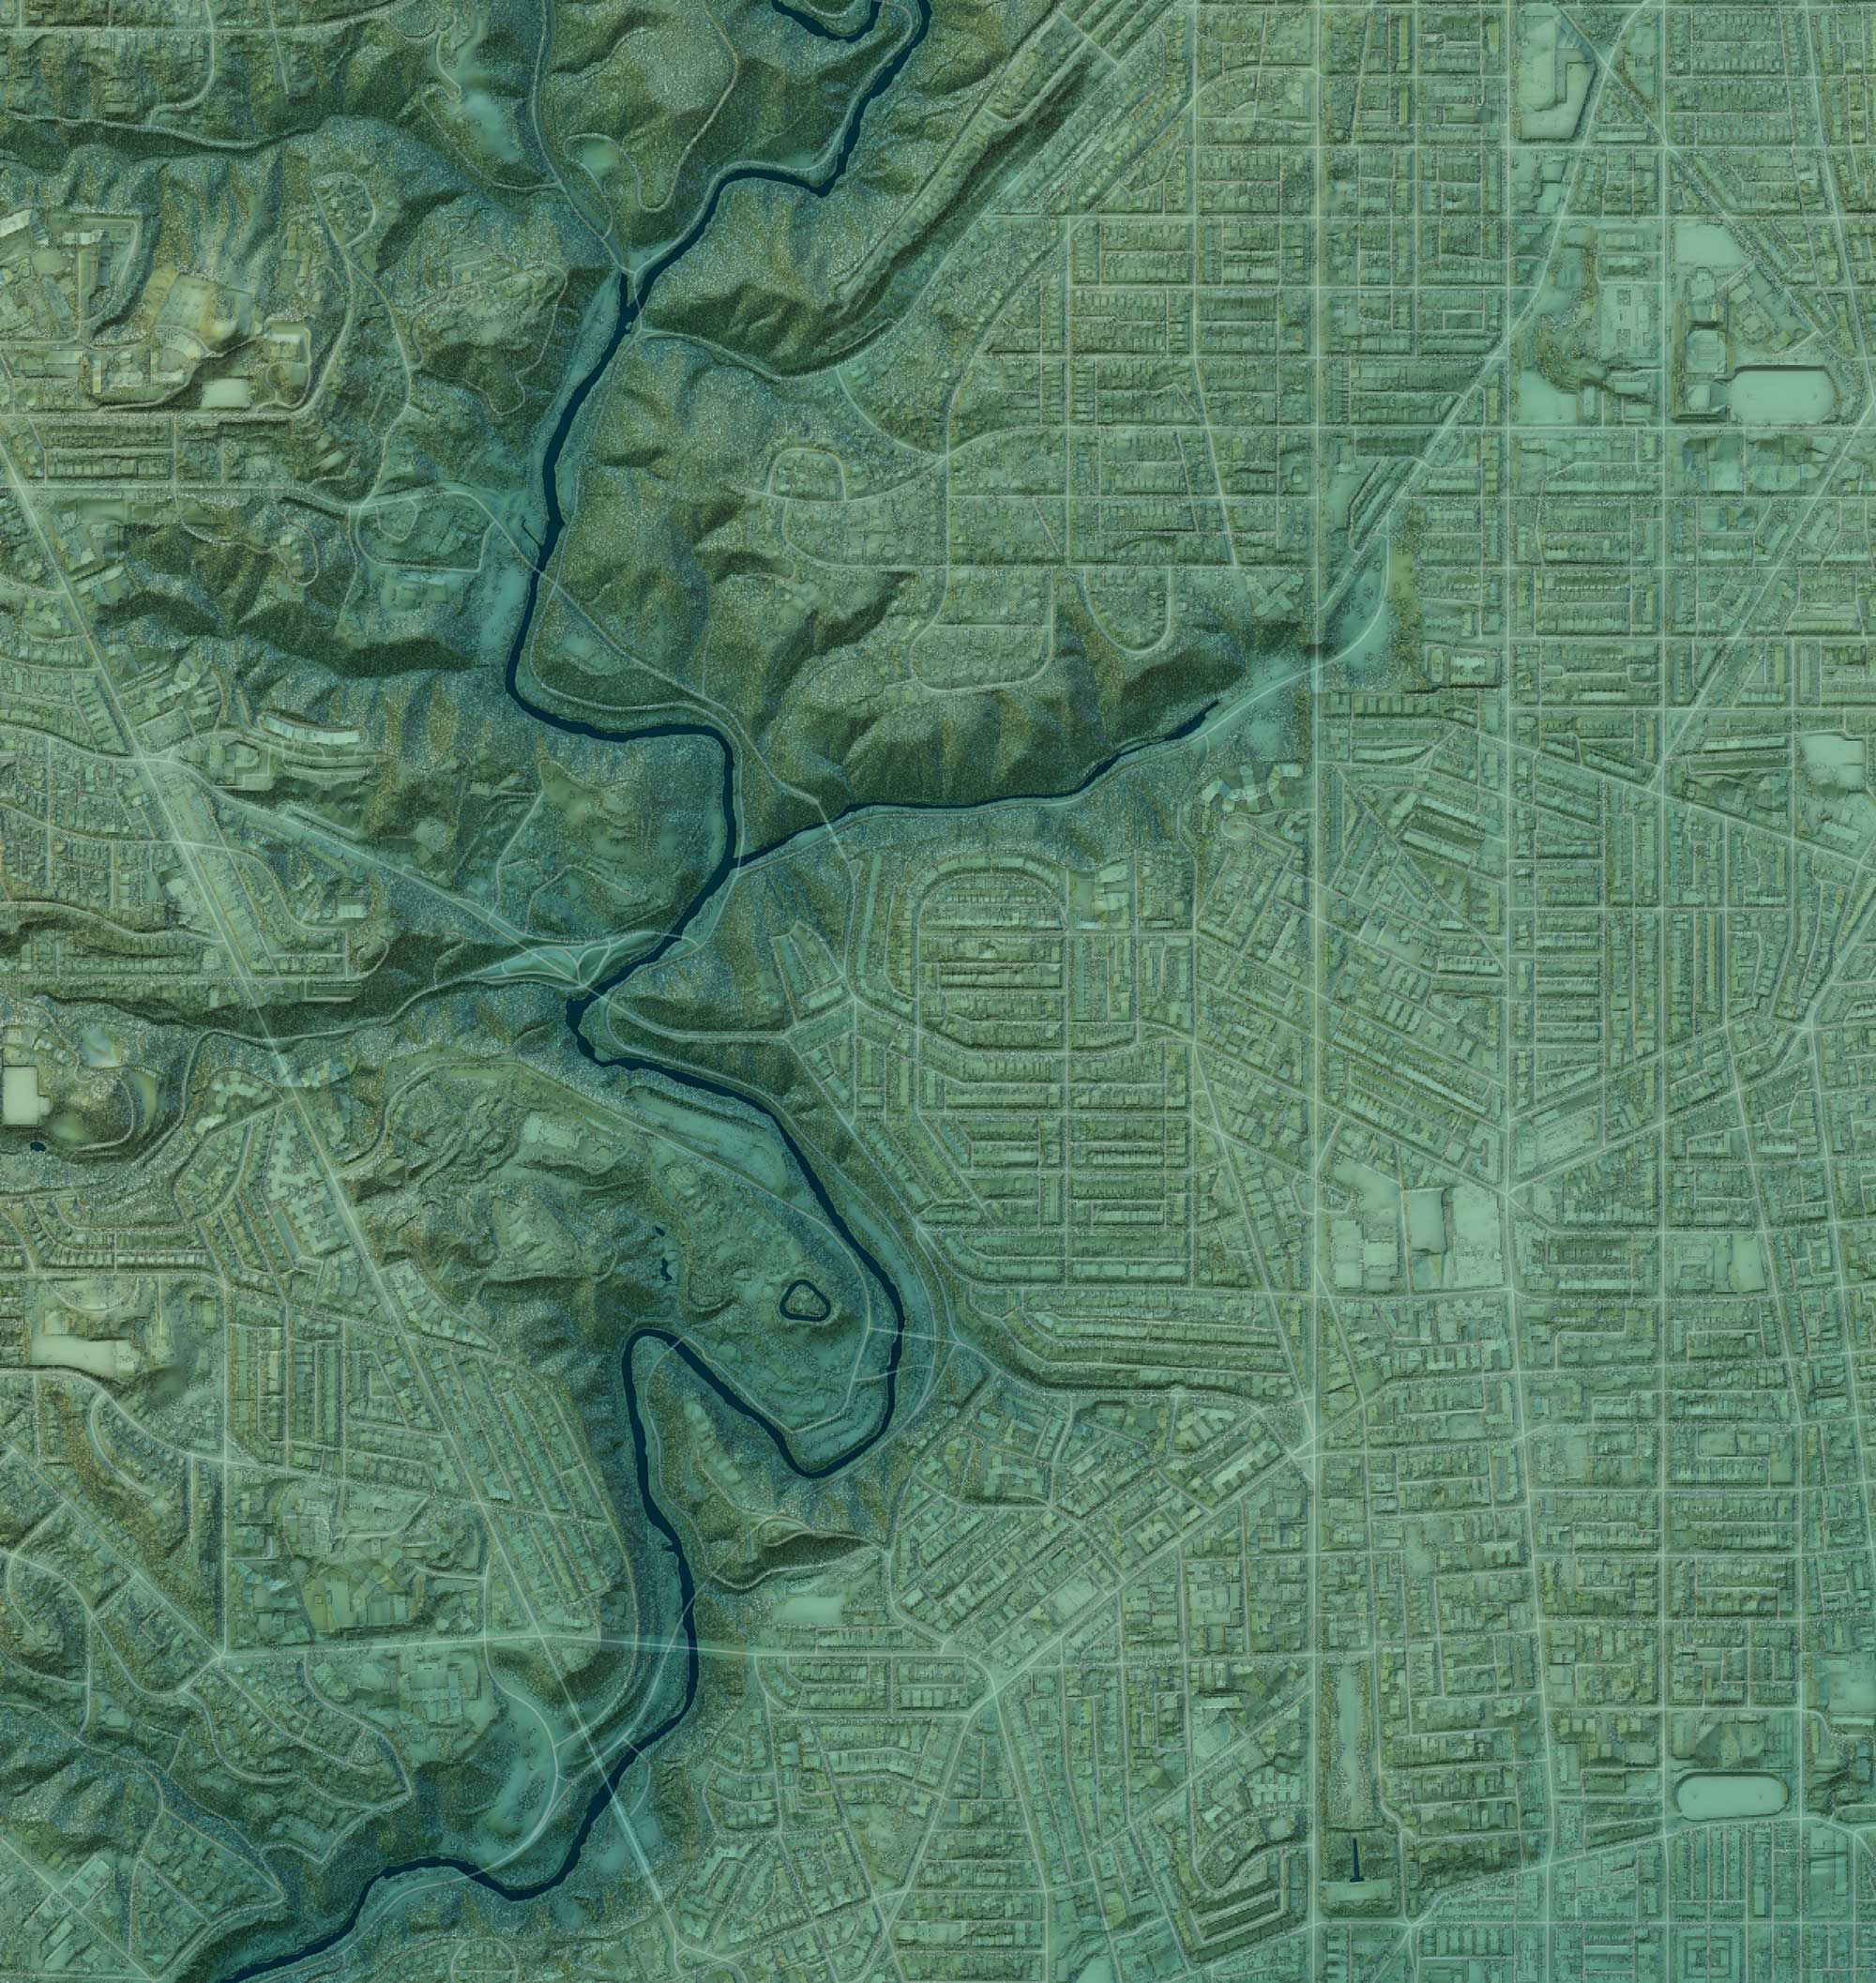
The area around Adams Morgan, Mt. Pleasant, and central Rock Creek Park. Piney Branch flows through top center. Rather than show forest as a tint, this map actually depicts every large tree in the city. The forest cover is a texture, but it’s also displaying the true position of individual trees.
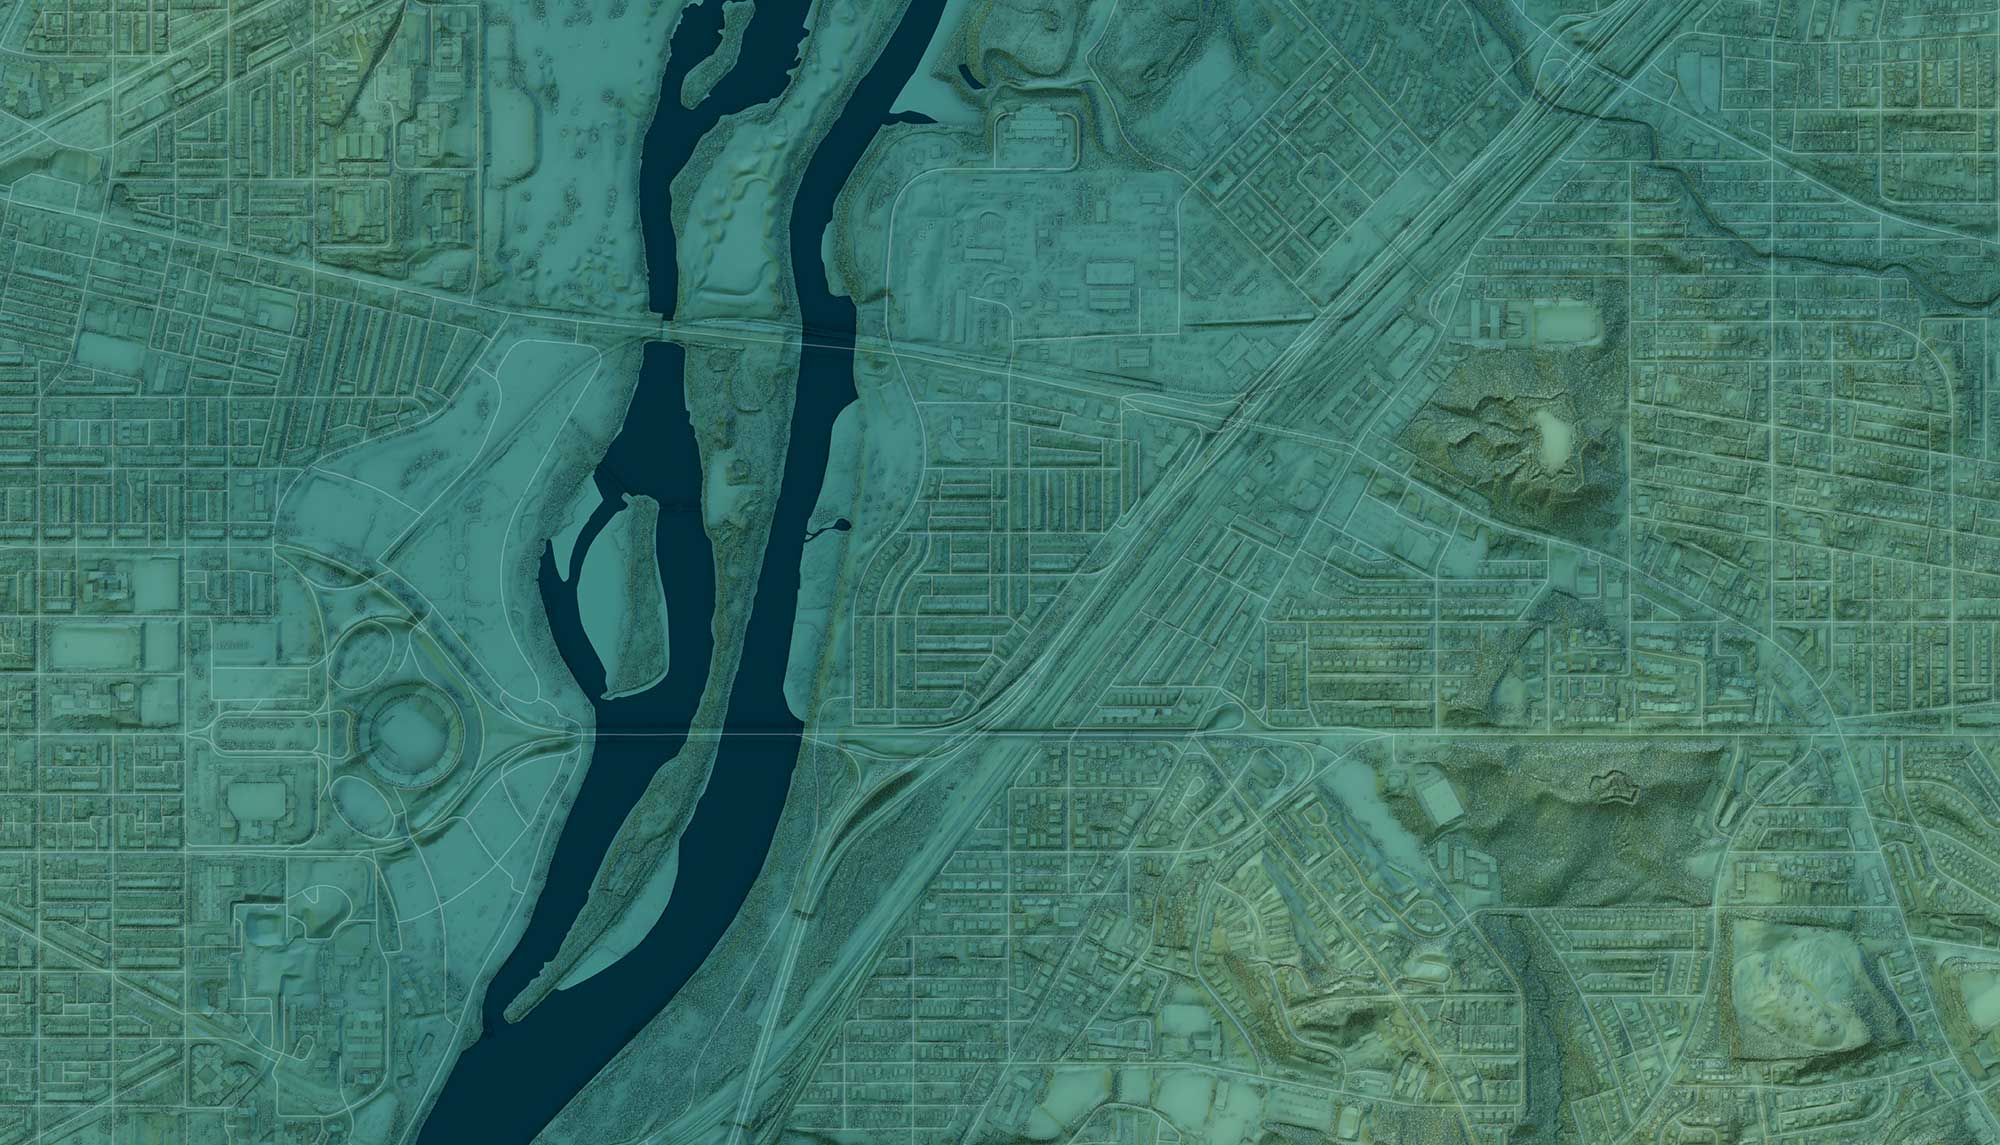
The Anacostia River and Kingman Island. On the hills to the right are Forts Mahan and Meiggs, part of the chain of defensive works that guarded the city during the Civil War.